The Dan Wilson Effect

The Seattle Mariners 2024 season is over.
In fact, it’s all over; three weeks ago, the Los Angeles Dodgers, buttressed by a 241-million-dollar payroll, which included fifteen million dollars for one-time Mariner Teoscar Hernández – 3rd highest on the team behind former MVP’s Mookie Betts and Freddie Freeman thanks to some unique, historic accounting – put the season to rest by defeating the New York Yankees in a five-game world series.
The Yankees were backed up by their own well-supplied payroll of 309 million dollars, which included 40 million dollars for Aaron Judge and another 31 million for Juan Soto, the latter of whom is entering free agency this offseason, but is unlikely to wind up a Mariner in 2025.
While the Yankees came back to the Bronx dissapointed, they taught us an important lesson: even 300 million dollars can’t guarantee you bring home a title.
Which should be welcome news to Mariners fans, as the paltry-in-comparison 148-million-dollar payroll is unlikely to more than double in this coming offseason. The Seattle Mariners, simply put, don’t have that kind of money. Or maybe they do, but they aren’t and won’t be spending it all on free agents. In either case, it’s an exercise in letting go to accept that their budget is not something that you (sorry - thank you for reading, John Stanton) or I are likely to have control over anytime soon.
What the Mariners lack in revenue, or in willingness to accept market-standard operating income, they more than make up for in something that money alone cannot buy – nostalgia.
Following the somewhat rocky firing of long-time manager Scott Servais towards the end of August, Mariners Hall of Famer and former catcher Dan “The Man” Wilson took over the coach spot in non-interim capacity. He would lead the team through the end of the 2024 season with the hope of righting the proverbial ship and, if the stars aligned, could even begin his managerial career with a playoff appearance.
While the Mariners fell just a game short of the postseason (for only the 4th time in recent memory, with the team finishing one game short of a playoff spot in 2023, 2021, and 2018 as well), the 2024 crew’s performance under Dan Wilson was a respectable 21 wins and 13 losses. Strength of schedule and sample size concerns aside, the end of the season was a welcome change of pace from the one-win, eight-loss road trip that preceded Servais’s firing.
Apart from a four-game, in-division skid of one-run losses that began at the end of August, the Dan Wilson Mariners certainly felt like a better team. The much-maligned hitting woes, which were so agonizing they left the stellar performance of the pitching staff feeling like a foot-note on the season, seemed to stabilize. Maybe we were all delirious and fueling each other’s increasing detachment from reality, but the vibes were up – did the numbers have our back?
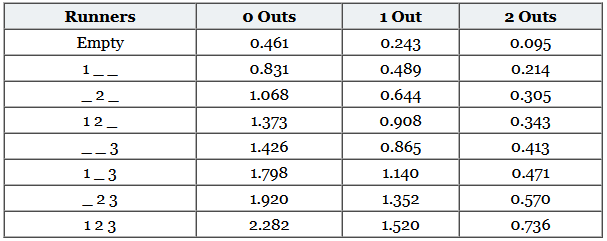
In comparing these distinct eras, I’ll look to a catch-all hitting stat made readily available in the Statcast datasets I’ll be pulling from - Neil Weinberg of Fangraphs’ RE24, or "Run Expectancy based on 24 base-out states", or simply “run expectancy”.
RE24 compares the result of a given play to the expected runs given the number of outs and the location of baserunners, with slight adjustments in the calculation to account for the specific ballpark factors or “run environment”. RE24 is context-dependent, but doesn’t favor batters who more often come to the plate in favorable situations – driving in a runner from 3rd with no outs is worth less RE24 than a bases-empty solo-home-run, for example, while both at-bats would equally grant one RBI.
Weinberg, Neil. "RE24" Fangraphs, 30 June 2014, https://library.fangraphs.com/misc/re24/
As Dan Wilson took over the team, he had the benefit of stability: the trade deadline was nearly a month behind him, and the postseason roster eligibility cutoff was only a week away. The Scott Servais Mariners were a far more experimental troupe, featuring ten batters who didn’t get to stake their claim as original cast members in the Dan Wilson era, including Jason Vosler, Seby Zavala, and a handful of minor league callups from Ryan Bliss and Jonatan Clase, among others. Scott had to deal with this revolving door of batters that Dan didn’t, so in the interest of a more-fair comparison, I’m only looking at batters that played under both managers. In total, Dan took over fourteen batters from the Sevais era:
common_batter_set = dan_batter_set.intersection(scott_batter_set)
common_batters = playerid_reverse_lookup(common_batter_set, key_type='mlbam')
common_batters[['name_last', 'name_first', 'key_mlbam']]
name_last name_first key_mlbam
0 polanco jorge 593871
1 haniger mitch 571745
2 canzone dominic 686527
3 raley luke 670042
4 moore dylan 664238
5 crawford j. p. 641487
6 rodríguez julio 677594
7 urías luis 649966
8 rivas leo 660844
9 raleigh cal 663728
10 garver mitch 641598
11 rojas josh 668942
12 robles víctor 645302
13 arozarena randy 668227
14 turner justin 457759
To tidy things up a little bit further, and to pave the way for some more detailed analysis later, I trimmed the data sets again to only look at pitch types which were seen by both iterations of the 2024 ballclub:
common_pitches_faced = scott_pitches_faced.intersection(dan_pitches_faced)
common_pitches_faced
{'CH', 'CU', 'FC', 'FF', 'FS', 'KC', 'SI', 'SL', 'ST', 'SV'}
The Servais Mariners saw four pitch types that the Wilson Mariners did not – over half of these were eephus pitches thrown in blowout Mariners wins from position players Emmanual Rivera, Garrett Stubbs, and Cole Tucker, which, all together, the Mariners hit for 0.517 runs below expected.
scott_pitches_faced.difference(dan_pitches_faced)
{'EP', 'FA', 'PO', 'SC'}
Another small number were unclassified (though these were all thrown by the same three position players just mentioned, so we can consider these more eephus pitches) along with two pitchouts, while seven were screwballs from Colorado Rockies pitcher Noah Davis on April 21st, which the early-season Mariners racked up .678 runs over expected on, including a flyball single by Julio Rodríguez to score Seby Zavala in from 3rd base.
The Dan Wilson Mariners saw just one pitch type that the Servais Mariners did not: a first-pitch slow curve from Miles Mikolas on September 8th to Jorge Polanco, starting an at-bat which would result in Jorge’s first of two strikeouts against the Cardinals starting pitcher that day, in a game the Mariners would go on to comfortably win 10-4.
Among all batters in our common batter set, against all pitches in our common pitch set, the combined leader across all plate appearances in the Servais era with 7.061 runs over expected was Cal Raleigh.
batters_vs_pitches_scott.transpose().sum()
571745 -6.852
668227 2.344
660844 0.515
670042 3.920
664238 -1.057
668942 -9.568
649966 2.866
663728 7.061 <--- Cal Raleigh
641487 -3.660
593871 -5.922
645302 3.581
677594 -2.185
457759 -0.495
641598 -9.739
686527 -10.318
Cal’s single best hit by this metric? A 3-run homer against Angels pitcher Kenny Rosenberg in the top of the 6th to score Jonatan Clase and J.P. Crawford on July 11th, worth 2.652 runs over expected. Under Scott, Cal batted into five other pitches resulting in more than two run expectancy, all home runs including his two grand slams on May 7th and June 10th against Steven Okert of the Minneapolis Twins and Jordan Leasure of the Chicago White Sox, respectively.
If you’ve tried to keep track of the math up to this point, you would note that six total batting plays of greater than two runs over expected adds up to more than Cal’s total runs over expected of 7.061 under Scott Servais. Of all 1,940 pitches Cal saw in that stretch of the season, 978 resulted in negative run expectancy. The lowest, or by this metric his ‘worst’ result, came on August 11th in the bottom of the 7th against New York Mets pitcher Phil Maton in the form of a bases-loaded flyout to former Mariner Jesse Winker, worth -0.771 in run expectancy.
It's unclear if the feeling is mutual, but we still love you around here, Jesse.
Fanduel Sports Network West. 26 June 2022,screenshot via https://larrybrownsports.com/baseball/jesse-winker-flips-off-angels-fans/599601
Cal continued to dump well through the end of the season, accruing another 4.494 in run expectancy under Dan Wilson. On a per-pitch-seen-basis, this was over double the clip he played at under Scott – averaging one run over expected every 127 pitches, compared to one every 275 pitches before the switch.
The best batter by this metric in the Dan Wilson era was one of the Mariners’ newest shining stars, one-time Rookie of the Year vote-receiver and offseason monkey enthusiast, Víctor Robles, batting for a total run expectancy of 14.758 to close out the season.
batters_vs_pitches_dan.transpose().sum()
571745 -5.572
668227 0.536
660844 -2.346
670042 6.791
664238 0.854
668942 -5.547
649966 3.367
663728 4.494
641487 -3.038
593871 -5.324
645302 14.758 <--- Víctor Robles
677594 11.939
457759 4.972
641598 1.624
686527 -0.961
Of Víctor Robles’s eight batting events that resulted in more than one run over expected, only one was a home-run – the rest were no-nonsense doubles and singles. The highest runs-over-expected among these came on September 4th, on a one-out, bases-loaded line-drive double off a first-pitch cutter from Oakland A’s pitcher Stripling Ross in the top of the 8th, driving in two runs from Cal Raleigh and Randy Arozarena, and accruing 1.919 runs over expected.
Having seen just 334 pitches in the last 34 games of the season, Víctor accrued run expectancy at a rate of one additional run every 22.6 pitches, or one every 7 at-bats. In the leadoff spot, we can essentially think of that as generating one extra run every other game. Extrapolated out to a full season’s pace, that would result in a total run expectancy of 72.448 runs on the year – which FanGraphs (among other bewildered onlookers in this made-up scenario) would describe as “Excellent”.
While Víctor swung the hottest bat under Dan’s leadership, he had largely hit well since he arrived in the pacific northwest in early June. Considering he saw only 543 pitches while being coached by Scott, the 3.581 run expectancy he accrued was better on a rate-basis than Cal’s in that same stretch – that same stretch being since Víctor’s signing on June 4th, and just barely; one run over expected every 151.6 pitches for Víctor versus one every 155.7 pitches for Cal.
In terms of improvement, the batter with the largest difference between their accrued run expectancy under Scott and under Dan was Julio Rodríguez.
batters_vs_pitches_difference = batters_vs_pitches_dan - batters_vs_pitches_scott
batters_vs_pitches_difference.transpose().sum()
571745 1.280
668227 -1.808
660844 -2.861
670042 2.871
664238 1.911
668942 4.021
649966 0.501
663728 -2.567
641487 0.622
593871 0.598
645302 11.177
677594 14.124 <--- Julio Rodríguez
457759 5.467
641598 11.363
686527 9.357
There were many, many disappointed conversations, both by Mariners fans as well as in national sports media, about Julio’s “slow start” in 2024. Under Scott, Julio’s run expectancy was a net negative – in our sample he posted a total of 2.185 runs below expected. To be fair, this isn’t a horrible result, as run expectancy averages out across the league to zero. But from the team’s flagship player, slightly below average just isn’t what’s being asked.
I broke down Julio’s opportunities during that cold stretch by pitch type in order to find his most formidable opponent, and it was the changeup. Against the 186 changeups thrown to him during the season under Scott, he batted for a combined run expectancy of -6.266.
batters_vs_pitches_scott.loc[677594]
FC -0.851
CU 1.232
FS -2.259
SL 0.127
KC -1.539
ST -2.272
CH -6.266
SI 5.544
FF 4.389
SV -0.290
In that same period of time, against the 45 changeups that led to a baseball event (i.e. resulted in an out and/or a player reaching base) Julio struck out on 21 of them, was thrown or caught out on another thirteen, and grounded into two double plays. He managed to eke out just two walks and six singles off the changeup, with the only RBI coming off a fielder’s choice force-out against Andrew Heaney on June 14th to score J.P. Crawford in from 3rd.
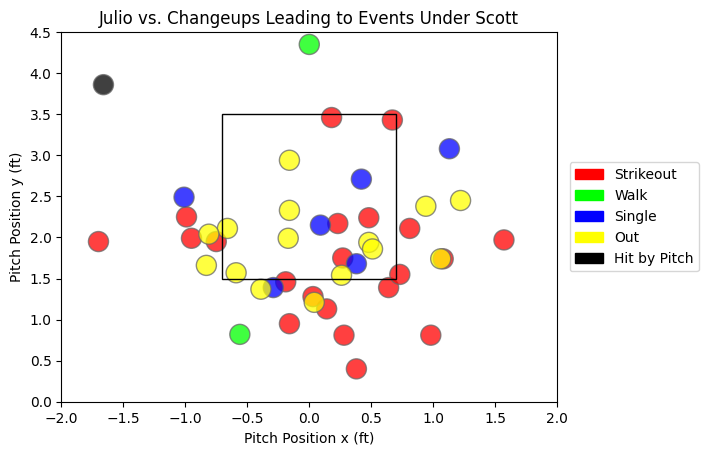
If you were a regular ROOT Sports viewer this year, the above should come as no surprise. Julio’s strikeouts against the low-and-away, off-speed pitch might have defined his 3rd major league season.
His weakness to this pitch was no secret. In this sample, only seven of the 45 changeups were thrown at or above 2.5 feet – the approximate mid-point of Julio’s strike zone – meaning 84% of the time, opposing pitchers opted to go low against him.
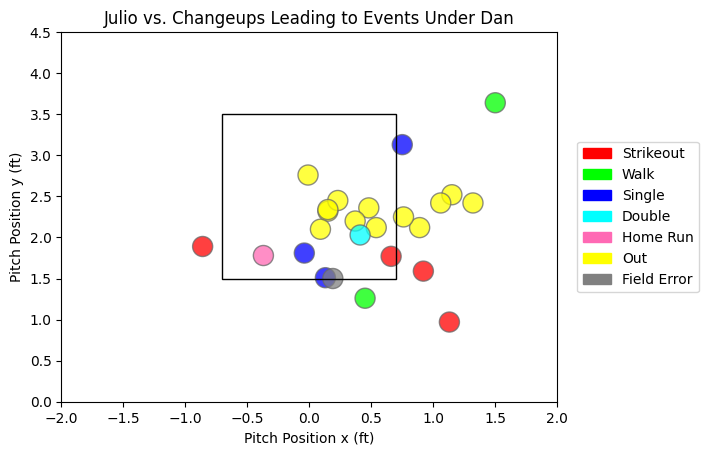
That strategy from opponents continued through to the end of the season. In the above showing Julio’s performance against the 25 changeups leading to baseball events that were thrown to him under Dan, only four were thrown at or above the midpoint of the zone for the exact same "go-low" rate of 84%. Julio also continued to strike out against the low-and-away changeup when attacked there, with three out of the four strikeouts being placed in that quadrant.
Despite this, he still significantly cut down on strikeouts elsewhere, and improved his efficiency against the changeup overall, recording another three singles as well as his first double and home-run against the pitch on the season. His home-run was no gimme either – a solo-shot against the Rangers’ Max Scherzer on September 14th on a 1-2 count in the bottom of the 3rd inning.
While we look to Julio as perhaps the Mariner most desperately in need of sustained improvement, given the lofty expectations of him, I also want to quickly highlight the 2nd-most improved batter of the Dan Wilson era by run expectancy – Mitch Garver.
571745 1.280
668227 -1.808
660844 -2.861
670042 2.871
664238 1.911
668942 4.021
649966 0.501
663728 -2.567
641487 0.622
593871 0.598
645302 11.177
677594 14.124
457759 5.467
641598 11.363 <--- Mitch Garver
686527 9.357
Yes, it’s backup catcher/designated hitter and 2023 World Series winner, Mitch Garver. Mitch G’s accrued run expectancy under Scott was a poor -9.739, second lowest in our sample behind Dominic Canzone, who racked up (down?) -10.318 run expectancy. In that final stretch of the season, however, Garver managed to hit for a definitively-better-than-league-average 1.624 runs over expected. In the span of just 242 pitches, that’s a rate of 1 run over expected ever 149 pitches, similar to Cal and Víctor’s respectable paces earlier in the year under Scott.
Mitch G’s best hit by run expectancy came on September 15th off a two-out, first-pitch fastball from former teammate Andrew Heaney in the bottom of the 1st, driving in Justin Turner and Randy Arozarena for 2.650 runs over expected. These would be the only three runs given up by Heaney that day as the Mariners would go on to shut-out the Rangers, 7-0.
So what caused the Mariners’ observed upswing in hitting performance in the final stretch of the season? Julio gave some of the credit to another big name in the Mariners franchise, fellow hall-of-famer to Dan and returning hitting coach, Edgar Martínez, crediting him with simplifying and streamlining the team’s approach at the plate.
Whether Dan and Edgar truly turned the ship around, or were simply buoyed by 14 combined games against the Rangers and A’s, something clicked in that final stretch, especially for Julio. If Mariners fans want to suffer less in 2025, we should hope that it sticks.